 Learning
MLOPS
- MLOPS
- Week 1
- Week 2
- ML Data Lifecycle
- Feature engineering
- Data Journey and data storage
- ML Deployment
MLOPS
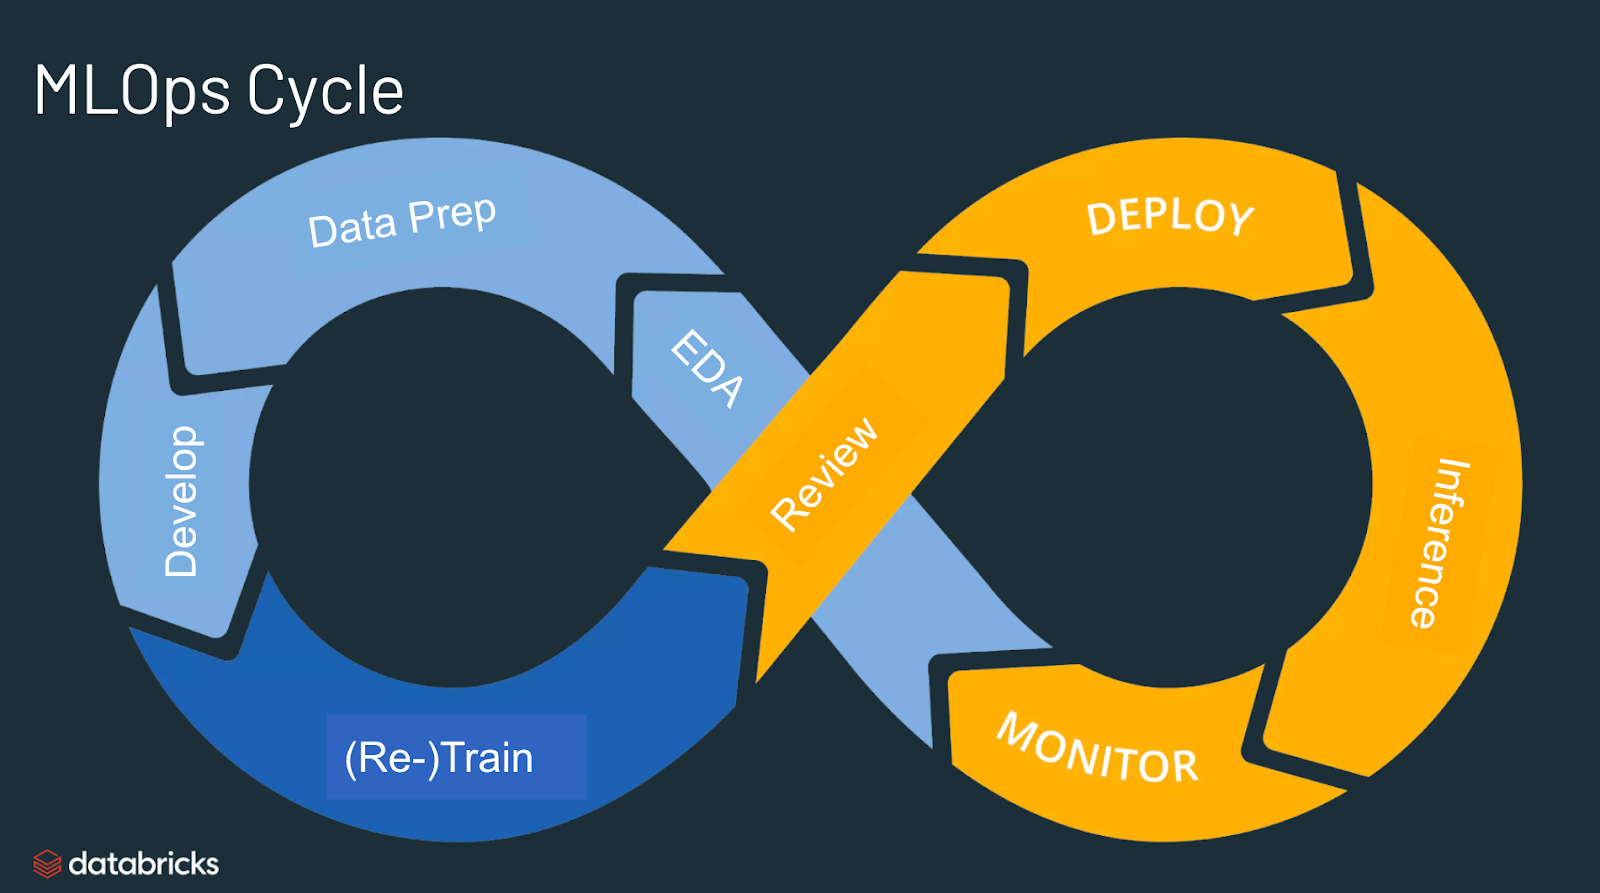
MLOPS machine learning operation which is an emerging discipline, and comprises a set of tools and principles to supper progress trough the ML project lifecycle.
Week 1
ML Project Lifecycle
The model production involves more than only build the actual model. The amount of code required is much more rather than the needed for the model, called “POC to production GAP”. Beyond the ml learning we have many others components:
- Data collection
- Data verification
- Feature extraction
- ML CODE
- Machine resource management
- Analysis tools
- Serving infrastructure
- Monitoring
all these pieces combined together create the ML infrastructure needed to deploy a ML production deployment.
Steps of ML project
the major steps are:
- Scoping: define project, what will be the X and the Y.
- Collecting & Defining Data: define the data, labelling and organize them.
- Modelling: select and train the model and perform error analysis.
- Deployment: deploy in production and monitor and maintain the system.
Speech recognition example
looking at the steps before the first step is to define the scope, one crucial decision is the key metrics used such as accuracy, latency, throughput. We have also to try estimating the resources and times.
the second step regard the data, talking about speech recognition the first questions could be “is the data labeled consistently?”. spotting consistency standardizing the convention could improve a lot the results. other question regarding the data could involve “how much silence before/after each clip?”, how do you produce volume normalization?.
then we have modelling in which we select and train a model, performing error analysis. in this phase we need to develop the code (model used, the hyperparameters used and the data. in product team usually we tend to change and try improve the hyperparameters and the data and keeping the algorithm fixed. in ML system turns out that is better to optimize the data and the hyperparameters rather than the model!
the last deployment phases involve the first choice if we will use a prediction server into the cloud or a prediction system in the edge. we send an API to the server with the requests and returning the result. Even after the deployment we have to monitor and maintain the system. for instance if we train the speech recognition model only on adults it could be the case if the system will be used by children it won’t work.
One of the key challenge is the concept/data Drift, which occurs when data change.
Key challenges
Concept drift and data drift
What happens when the data change after the deployment of the model? how has the data changed? the data can change gradual or suddenly (when covid appears a lot of credit card issue arise, for instance all were forced to purchase online and this trigger up a lot of anti-freud system).
- Data drift is the changing of the predictors X, The data drift refers in particular to the change of X and not the target variable.
- Concept drift refers to the mapping of x -> y(case of covid or if we are estimating the house prices we can say that this occurs when the market house increase, same X but higher Y).
Software engineering issues
The prediction software typically take an input X and return an output Y. we have to care about different situations:
- Realtime or batch data
- Cloud vs Edge service
- Compute resources (CPU/GPU/Memory) available
- Latency and throughput (QueryPerSecond)
- Logging
- Security and Privacy
the fist deployment will be very different from the maintenance of it.
Deployment patterns
common deployment cases occurs when:
- New product/capability
- Automate/assist with manual task
- Replace previous ML system
Every times we have some route like the gradual ramp up with monitoring (start slow and control, then augment); the possibility of rollback. an example of implementation could is called Shadow development in which ML system shadow the human runs in parallel, the output are not used for any decision during this phase. in this case we are evaluating basically the model.
When we let the algorithm make decision we can use a Canary development in which we roll out to small fraction of traffic initially, and we inspect that the model is performing well and we monitor the system and ramp up traffic gradually.
Another deployment patter is the blue green development, we are basically changing an old model to a new one. basically we spin up the router from the previous router to the new one. using this approach we can easy enable rollback traffic.
One of the most useful framework is not to see the deployment as zero-one but thinking as a proper degrees of automation such as:
human only -> shadow mode-> AI assistance -> partial automation -> full automation
Monitoring ML system
the best way is to use a dashboard that track how it works along time. We can track the serve load, the fraction of non-null outputs, fraction of missing input values. when decide what possible go wrong and find some metrics that can detect that problems. some examples of metric to track could be:
- Software metrics: memory, compute, latency, server load.
- input metrics: average in input length, number of missing values, or particular to the task like average image brightness.
- Output metrics: in case of speech recognition #times return None, # user redoes search.
the key is that only monitoring the system we can understand if there are some changes or some problems into the application and perform some correction.
Pipeline Monitoring
going on with our speech recognition example, the audio is passed to a voice activity detection (VAD) and if this recognize that someone is speaking then it is passed to the speech recognition and then it perform the transcription. the VAD is very useful so to send to the server only the needed information.
cascading effect can be difficult to track, we can use metrics to monitor to capture the element of each ML steps.
Week 2
Selecting and training a Model
We have two approaches: model-centric AI development and the Data-centric AI development.
[AIsystem = Code + Data]
since the code typically are already provided by others could be useful to improve the quality of the data or the hyperparameters rather than trying to improve the model itself. Model development is an iterative process, model + hyperparameters + code, training, error analysis and again. Model development is hard because they typically doing very well on training set but they have also to perform better on the test set. Lastly they also have to perform well on business metrics/project goals! this problem could occurs when we deal with disproportionally important examples (more errors are weighted more than others). Tne problem could be related to rare classes so related to skewed data distribution.
Establish a Baseline
One of the most useful operation is to establish a baseline for the performance of the model. for instance we can check the human level performance in all the situation and try to understand if there are some problems in particular types of task. We can notice that speech recognition in lowe bandwidth condition has an accuracy of 70% as the ML system so there is potential no space for improvement but in another spot there is.
The best practice to create the baseline differs if we are working with structured and unstructured data. When we are dealing with unstructured data like image, audio and text it is very useful to use HLP (Human performance performance) to create baseline. Another way to establish a baseline could be the literature search for state-of-the-art already present.
baselines helps to indicates what might be possible. in some cases is also gives a sens of what is irreducible error.
Tips for getting started
- Literature search to see what’s possible (do not search the latest super fancy model but pick something reasonable).
- Establish a baseline.
- A reasonable algorithm with good data will often outperform a great algorithm with no so good data.
- Sanity check for code and algorithm, try first on small dataset before passing to the whole dataset.
you also should take into account deployment constraints when picking a model.
Error analysis and performance auditing
We can identify possible problems and create a spreadsheet investing personally which are the misclassified or error of the ML system trying to investing where the ML has more problems.
Taking another problem in visual inspection when regarding specific class labels (scratch, dent), or the error could occurs in particular image properties or some other meta-data like the phone model or factory.
- What fraction of errors has that tag? there could be some very useful indication to reduce the overall errors
- of all data with that tag, what fraction is misclassified?
- what fraction of all the data has that tag?
we also establish metrics to assess performance against these issues on appropriate slices of data.
Prioritizing what to work on
what percentage of data has those category? is worthful to perform and trying to improve the performance on that particular category? we have to control the overall distributions of the records understanding what are the margin to improvement of each class and decide where we can improve the situation.
- how much room for improvement there is.
- how frequently that category appears.
- or how easy is to improve accuracy in that category?
- how important it is to improve in that category.
Skewed datasets
Many scenario have a very unbalance classes or skewed dataset, for instance in manufacturing maybe we can reach 99.7% of y=1 and 0.3 of y=0.3. in this case row accuracy is not a useful metrics because print every time zero can return a 99.7% of accuracy.
More useful is to draw the confusion matrix with the predicted value and the actual value;
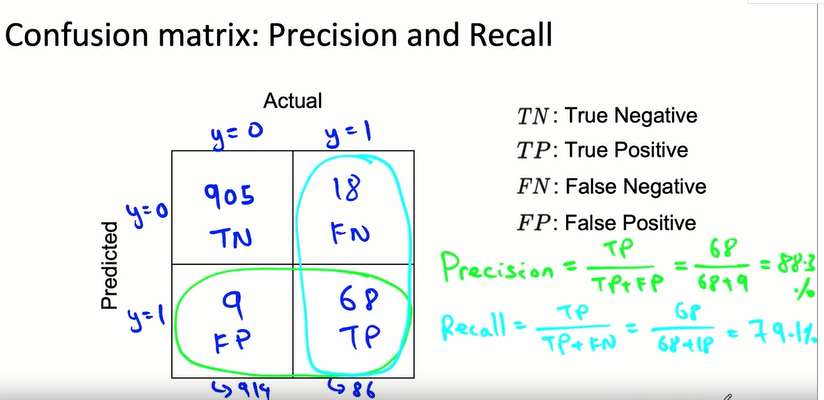
the precision is defined as follow:
[Precision = \frac{TP}{TP+FP}]
in contrast the recall is defined as follow:
[recall = \frac{TP}{TP+FN}]
- what happens when the model spit out every time zero?
in this case the precision is equal to 0/0 while the recall will be 0%.
F1-Score
we can combine the precision and the recall in one further measure called F1 score.
[F_{1} = \frac{2}{\frac{1}{P}+ \frac{1}{R}}]
we can use this metric even when we have multi-class target.
Data iteration
Having a model-centric view having the data that we have we try to improve the results as possible. The academy works in this way, we take the data fixed and interactively we improve the code/model. Another prospective is the data-centric view in which the quality of the data is central. We typically have the model fixed while we try to improve the data that we have.
Data Augmentation
There many ways to perform data augmentation, we are basically recreating artificially new observation.
- Create realistic examples that (i) the algorithm does poorly on, but (ii) humans do well on.
Data iteration loop
Taking a data centric approach is useful to use a data iteration, we add/improve data, we train the model and we perform error analysis.
- can adding data hurt performance?
for unstructured data problems, if:
- the model is large (low bias)
- the mapping x->y is clear (also human can make accurate predictions)
then adding data rarely hurts accuracy. But if the model is not large in that case it could case problem. the second problem is when the mapping from x->y is not clear.
Experiment tracking
There is a need to track the experiment and the result done so far. Something that we have to track is:
- Algorithm/code versioning
- Dataset used
- Hyperparameters
- Save results somewhere
Some tracking tools are:
- Text files
- Spreadsheet
- Experiment tracking system
there is the need to take notes of information needed to replicate results. Experiment results, ideally with summary metrics/analysis.
Why define hard is hard?
If we take the image recognition vision we have to care about the data labelling, having inconsistent labelled data could raise many problems. for many practical application the data preparation is crucial to improve the performance of the overall ML works. It could be also the case when dealing with structured data is that the target label is ambiguous!
What is the input X?
- lighting? contrast? resolution? garbage in -> garbage out
- when dealing with structured data, what features need to be included?
What is the target label y?
- how can we ensure consistent label?
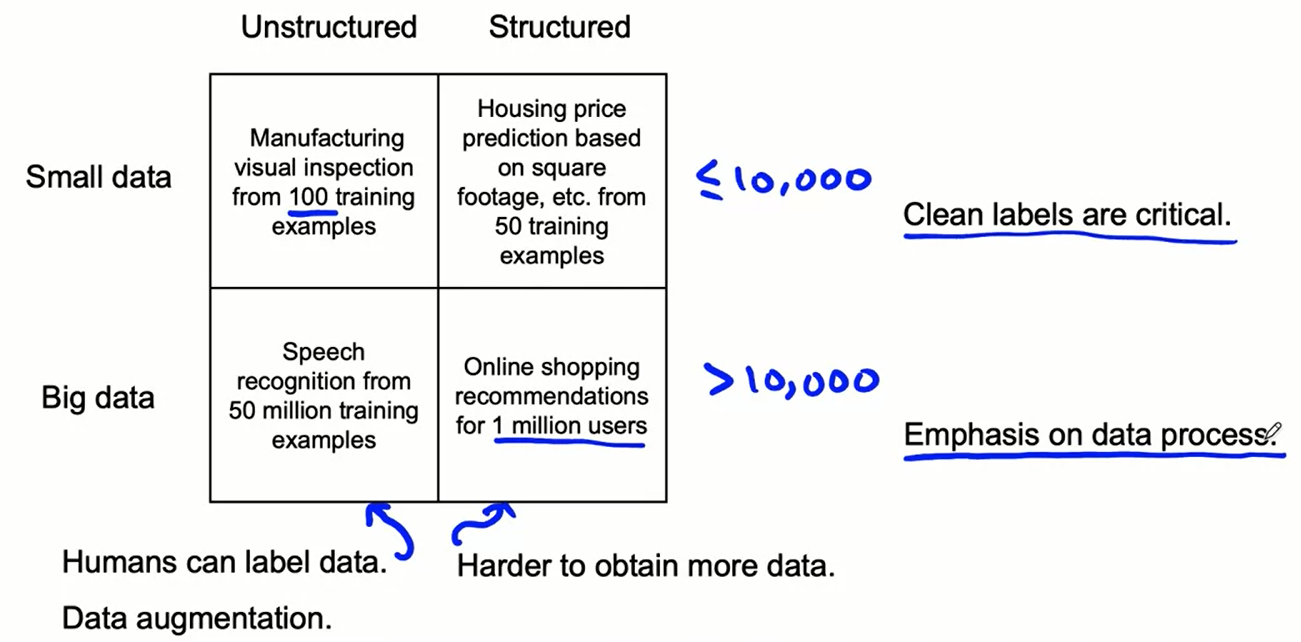
Mayor types of data problems
The problems changes a lot when we are dealing with unstructured vs structured data as well with small data (not precisely defined) or big data.
 {width=300}
when we have small data clean labels are critical, in particular when we have few observation it could be great to manually go trough each example to be sure that each label is ok!.
for small data cleans labels are critical, there is the possibility to manually look trough dataset and fix labels where needed (important consistent between labels). while for the very big data the focus is the emphasis on data process.
big data problems can have small data challenges too, this problems emerge when we have problems with a large dataset but where there’s a long tail of rare vents in the input that will ha small data associated.
How to improve label consistency
the first common solution is to have multiple labelers label same example and when there is disagreement discuss and reach the definition of the target and perform action according to that.
- Standardize the labels (find a consistent way of defining labels)
- Merge classes when there are classes similar that are not very well defined (hard vs shallow scratch)
- Introduce alternative as 0, borderline, 1.
- Define special token as [intelligeble] when there are data genuinely ambigous
Human level performance are very useful to estimate reducible error (especially in unstructured data). beyond the estimating error there are some other user of HLP. in academia, it is used to establish and beat a respectable benchmark to support publication. business or product owner asks for 99% accuracy; HLP helps establish a more reasonable target.
when the label y come from a human label, HLP « 100% may indicate ambiguous labelling instructions, improving label consistency will raise HLP.
Label and Organize data
how long should you spend obtaining data? considering that MLOPS is an iterative problems. An advise is to get into the iteration loop as quickly as possible. or if it could be the case we can ask: if you have worked on the problem before and from experience you know you need M examples.
But when there is no idea on how much data are needed and so on, starting the iteration loops as soon as possible is a great option since we can obtain useful information from error analysis.
when we have to label data whe have three options: In-house vs outsourced vs crowdsourced. Having MLEs label data is expensive, but doing this for just a few days is usually fine.
Data Pipeline
given the raw data we have to perform many operations before arriving to the actual prediction.
 {width=300}
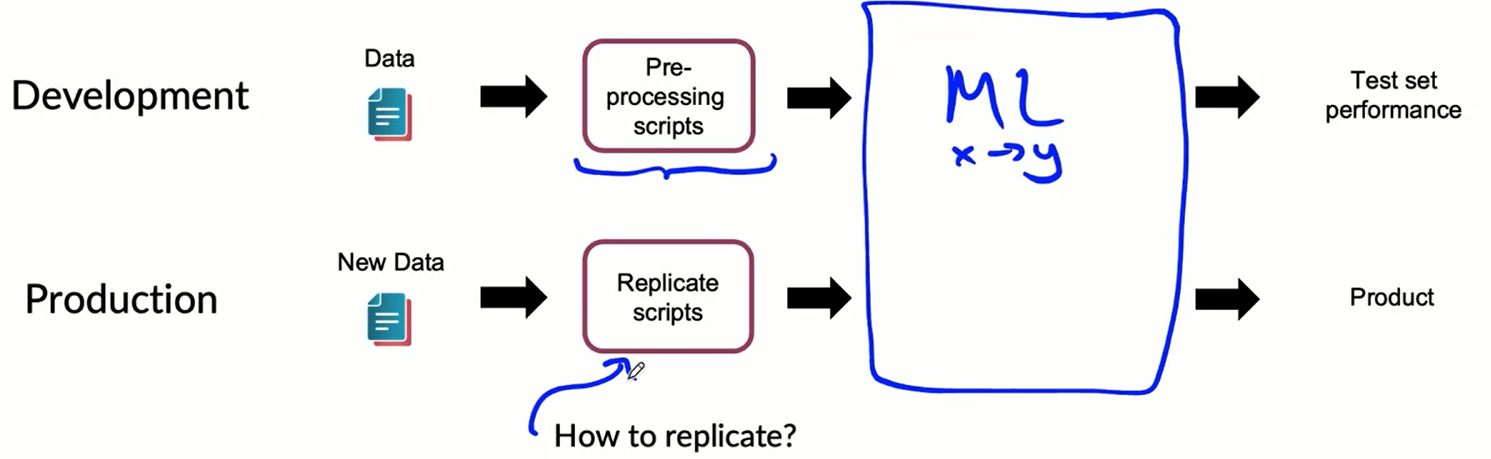
POC and production phases, in particular the Proof Of Concept:
- goals is to decide if the application is workable and wortg deploying.
- focus on getting the prototype to work.
- it is ok if data pre-processing is manual (but take extensive notes on how to replicate).
for some application having meta-data, lineage is very important. One challenge of the ML pipelines is to be able to decompose it and be able to work on small piece of it. the question is, once having built the pipeline how we can go back and fix problems?
To solve this problem is important to keep track of data provenance and lineage (where data come from and the sequence of steps that introduce that data into the pipeline). To make life easier we can use extensive use of meta-data, which are data about the data itself like the time, factory, camera settings, phone models and so on.
Balanced train/dev/test splits in small data problems
When we have small data we have to really care about the splitting. Perform a random train/test split is nod advisable (also when we have unbalanced class). A possible solution is to split the dataset according to the target distribution!.
- also important control for the distribution of the target variable before and after the split to control that the relative frequencies are well distributed.
ML Data Lifecycle
Data is the hardest part of ML and the most important piece to get right, broken data is the most common cause of problems in production ML system.
ML modeling vs production ML:
- static vs dynamic-shifting
- overall accuracy vs fat-inference, good interpretability
- optimal tuning vs continuously assess and retrain
- high accuracy model vs entire system
Managing the entire life cycle of data:
- Labelling
- Feature space coverage (same train and dev)
- Minimal dimensionality
- Fairness in particular to Rare conditions
And it most cover the modern software development requirement such as:
- Scalability
- extensibility
- Configuration
- Consistency
- Safety
- Modularity
- Testability
- Monitoring
challenged in production ML are very different from academic, we have to build integrated ML system (soft dev), it has continuously operate in production, deal with continuously changing data.
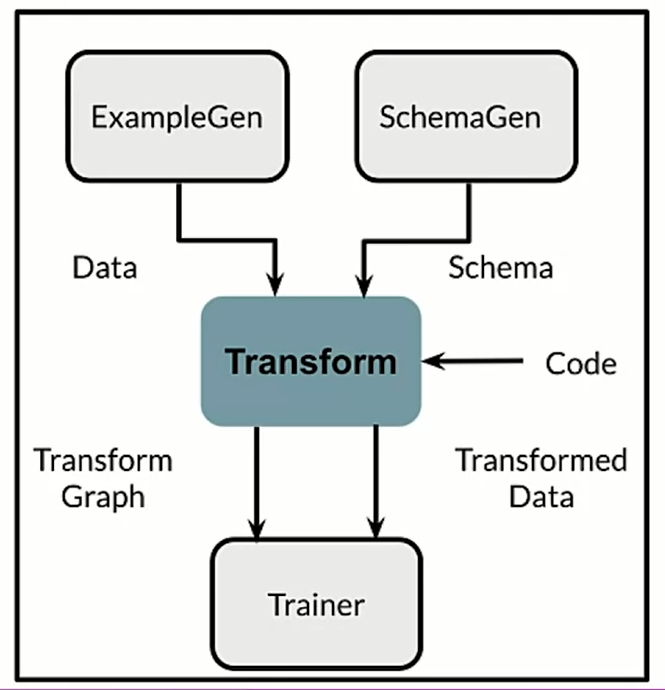
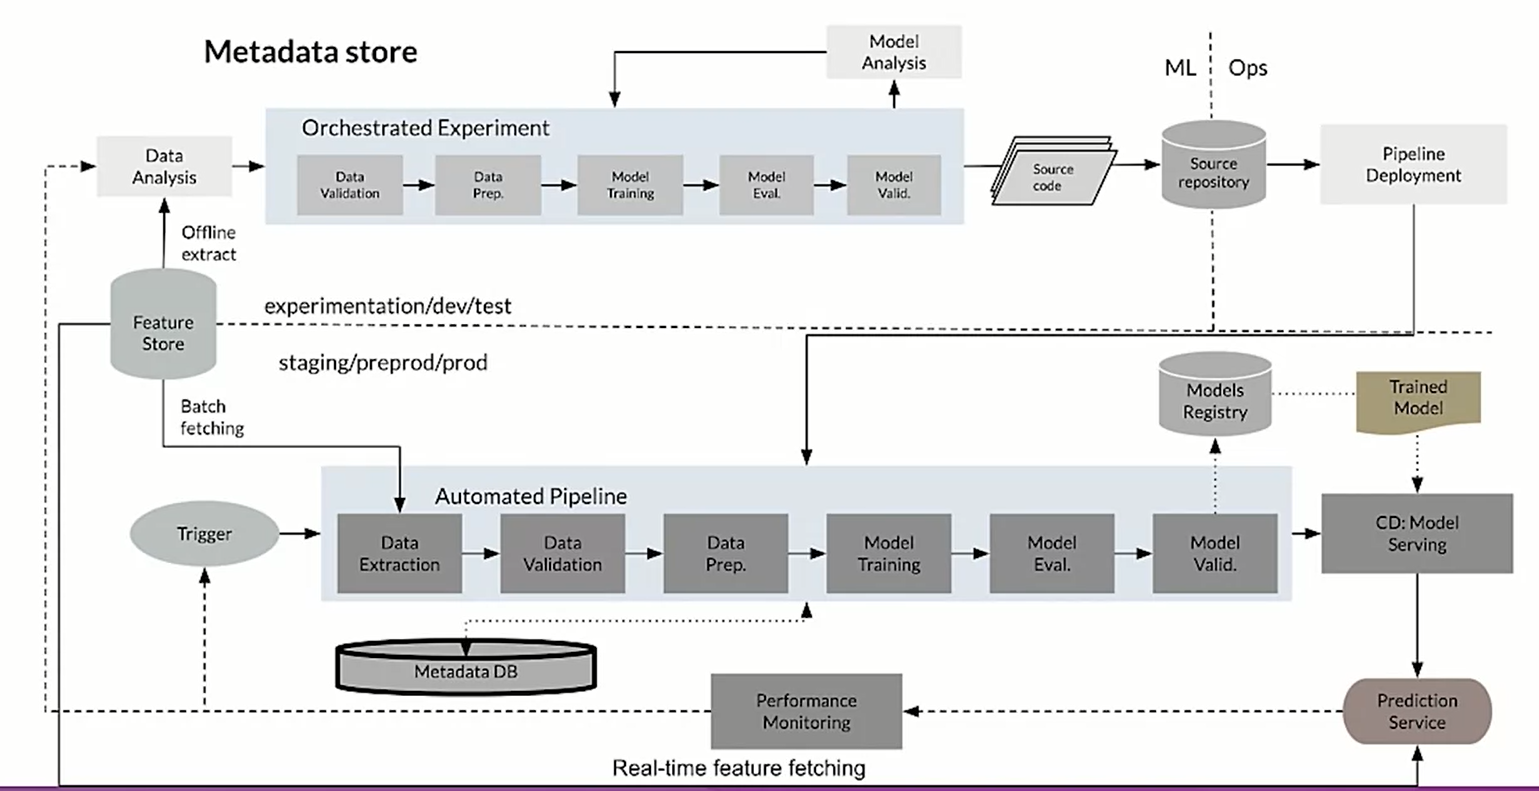
ML Pipelines
with ML Pipelines we need the infrastructure fo automating, monitoring, and maintaining model training and deployment.
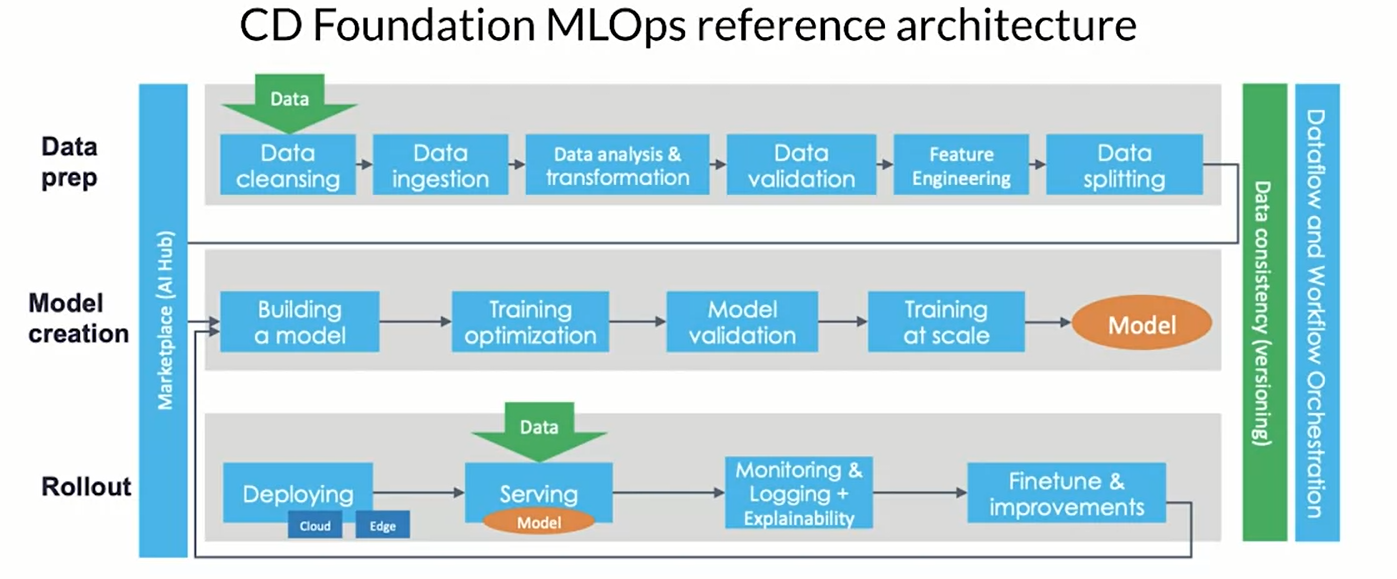
this is a directed acyclic graph (DAG), which is a directed graph that has no cycles. they define the sequencing of the tasks to be performed based on their relationship.
the orchestrator helps with pipeline automation (airflow, argo, kubeflow) and also TensorFlow Extended (TFX) is an end-to-end platform for deploying production ML pipelines.
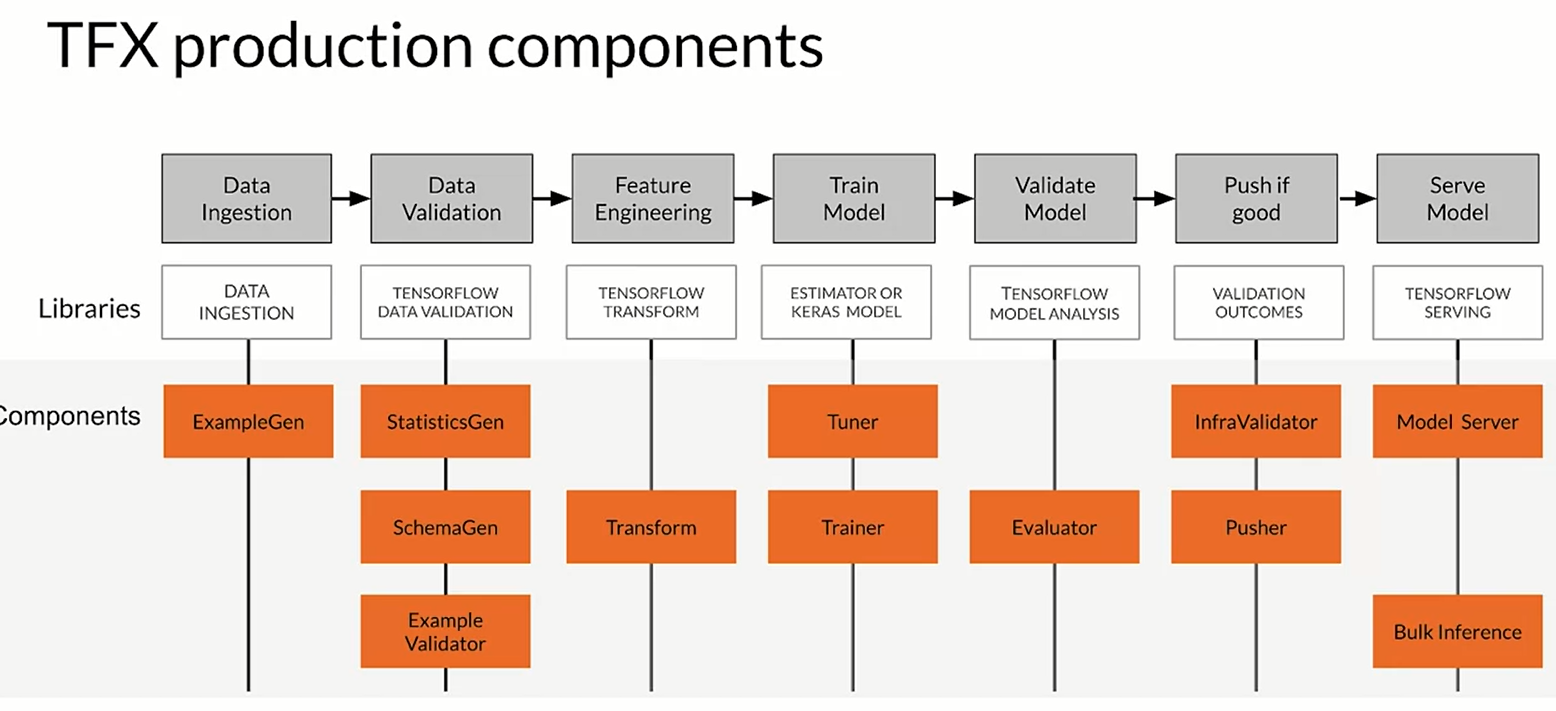
each component is crucial to understand the data that we have, generate schema, doing preprocessing and feature engineering. Tuner and Trainer are used to train the model while the evaluate and infra validator are to evaluate the model and test that the model actual perform well.
Collecting data
Collecting data in real world mean understading how to collect the necessary data. the importance of the data quality is crucial to the overall system; we will need data pipeline, automating the collection, ingestion and preparation;
when collecting data some key consideration are:
- what kind of/how much data is available?
- How often does the new data come in?
- is it annotated? if not, how expensive is it to get it labeled?
- translate user need into data needs
- data needed
- label needed
We can perform some preliminary operations such as:
- identify data sources
- check if they are refresh
- consistency for values, units & data types
- monitor outliers and errors and missing values
- Measure data effectiveness: the intuition about data value can be misleading, which features have predictive value and which ones do not?.
- Feature engineering helps to maximize the predictive signals
- Feature selection to measure where the predictive signal is
in a more general way we can summarize the first key concepts as:
- What kind of/how much data is available
- What are the details and issues of your data
- What are your predictive features
- What are the labels you are tracking
- What are your metrics
Degraded model performance
In ML system the degraded model performance is a real problem; the first question is how do we know that we have a problem? we have two types of problem, two different way of changing: 1. slow-example drift and fast example drift.
When dealing with gradual problems an example could be due to the data such as trend and seasonality, or it could be related to different distribution of the features (or relative importance of features changes); it could also due to the world changes such as style change, scope and processes changes, competitors changes and so on.
for sudden problem we can have data collection problem (bad sensor/camera), bad log data, moved or disable sensor/cameras; or it could be system problem such as bad software update, loss of network connectivity or system down.
detecting problems with deployed models means monitoring the models and validate data to find problems early, and if changing the ground truth you need to label new training data.
Process feedback and human labelling
two ways of data labelling are the process feedback and human labeling.
process feedback is very useful, we can perform a direct labelling, such a continuous creation of training dataset; for instance the we the features from the inference requests, we labels from monitoring prediction and asking a feedback we are able to identify if our prediction was good or not. The process feedback is done using log analysis tools (logstash);
an alternative is human labelling where you pay human to label new records:
- unlabeled data is collected
- human raters are recruited
- instructions tu guide raters are created
- labels are collected and conflicts are resolved.
in this case it could be very slow and there could be many dataset difficult for human labeling.
Detecting data issue
data issue are typically related to drift (changes in data over time) and skew (difference between two static versions like the training a serving data). the concept drift is when the labels meaning changing but not the data itself (see previous).
-
detecting schema skew: training and serving data do not conform to the same schema (changing literally the type of the data flowing in)
-
detecting distribution skew: dataset shift, changing the distribution of the data.
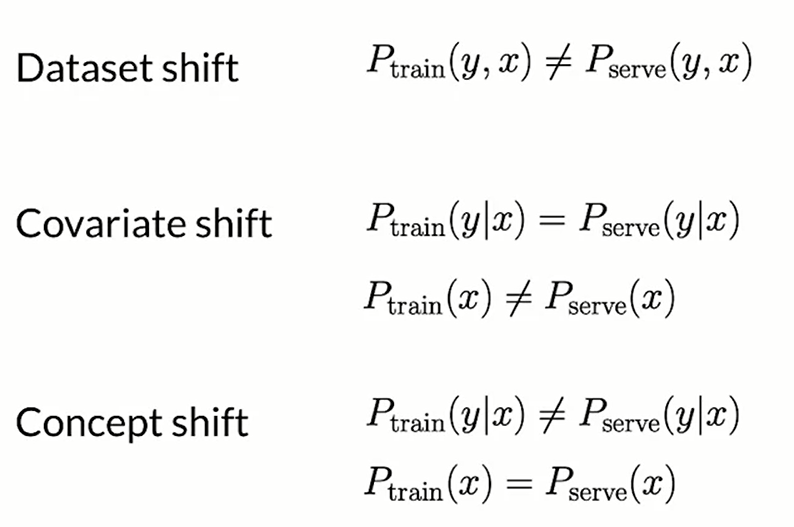
there is a straighforward way to detect skew detection; in the training data we collect the descriptive statistics and the schema; and later when we have serving data we calculate in the basic stats and then we compare them using validate statistics and if there are some anomalies some trigger are pulled and notification are raised.
TensorFlow Data Validation
TFDV helps developer understand, validate and monitor ML data at scale. it helps generate data statistics and browser visualizations, inferring the data schema; performs validity checks against schema and trying to detect training/serving skew.
Feature engineering
there are various technique to transform the data input to improve the quality of the model. Having a conceptual look at this using feature engineering meaning improving the model reducing the computational cost trying to combining, improving the data.
Across the ML pipelines we incorporate the data, combine the features, we tune objective function, we update the model making new features and lastly since it is a iteratively process we launch and reiterate all.
During training there is usually the entire training set, so we can use global transformation (std and use that to perform normalization) however we serve the model we have to be sure to be able to perform that trasformation as well. During serving is important to include global property used in training!
Preprocessing for feature engineering
preprocessing consists transform raw data into a clean a training ready dataset. we prepare, tunes, transform and extracts/constructs features.
One of the most important operation is the data cleansing (removing error data), then we perform feature tuning (scale and normalization), we can also perform dimensionality reduction.
-
Mapping categorical values: for instance if we have some categorical values and example could be creating an hot encoding operations. Or a better approach could be create vocabulary
-
Empirical knowledge of data, for instance in text we can perform stemming, lemmatization, TF-IDF, n-grams embedding lookup and so on. in images we can think about clipping, resizing, cropping, blur and so on.
Techniques
- Feature scaling
- Normalization and standardization
- Bucketizing/binning
Scaling means converts values from their natural range into a precise range (eg images are typically rescaled to [-1,1]); it helps the model to converge and dealing with NaN errors during training.
for Normalization the formula is:
[X_{norm} = \frac{X-X_{min}}{X_{max}-x_{min}}]
the normalization lives in [0,1], it is typically good if the distribution is not gaussian.
Standardization (z-score) is a way to scale using the standard deviation:
[X_{std} = \frac{X-\mu}{\sigma}]
the Standardization typically $\sim N(0,\sigma)$ the range in this case is -inf + inf (+2 means over 2 standard deviation!)
Talking about grouping we have Bucketizing, this technique is used for instance when we are dealing with dates we can group all the years from 1940 to 1960 into just one categorical value that will be encoded later.
Featuring engineering at scale
we have to care first of all at inconsistencies in feature engineering like the diverse deployments scenarios (mobile vs server vs web). There is a notion of granularity, we have to perform an instance-level (clipping, resizing) and a full-pass (minmax, standard scaling) operation.
we can perform the feature engineering at the whole dataset or within the model (batch per batch). both of these have pros and cons.
TensorFlow Transform
it does training data and process it, creating also meta-data storage. Meta data are important for the lineage of the data;
tftransform use apache beam to be able to process data in a very very fast way. Doing this operation we are using the same data in training and serving, this is very important so we are able to use the same data in serving layer. This is done saving a TFGraph.
the tf.transform analyzers can do different operations such that scaling, bucketizing, vocabulary and also dimensionality reduction.
import tensorflow as tf
import apache_beam as beam
import apache_beam.io.iobase
import tensorflow_transform as tft
import tensorflow_transform.beam as tft_beam

def preprocessing_fn(inputs):
    for k in DENSE_FLOAT:
        outputs[key] = tft.scale_to_z_score(inputs[key])
    """
    all the operations needed
    """
    return outputs
the operation that we typically do are in order:
- collect raw data
- define metadata
- transform
- generate a constant graph with the required transformation
see the notebook. Tft transform runs on apache beam which run on spark and flinn!
import tensorflow as tf
import tensorflow_transform as tft
import tensorflow_transform.beam as tft_beam
from tensorflow_transform.tf_metadata import dataset_metadata
from tensorflow_transform.tf_metadata import schema_utils
import pprint
import tempfile

# define sample data
raw_data = [
      {'x': 1, 'y': 1, 's': 'hello'},
      {'x': 2, 'y': 2, 's': 'world'},
      {'x': 3, 'y': 3, 's': 'hello'}
  ]
define the schema of the data with the DatasetMetadata class.
raw_data_metadata = dataset_metadata.DatasetMetadata(
    schema_utils.schema_from_feature_spec({
        'y': tf.io.FixedLenFeature([], tf.float32),
        'x': tf.io.FixedLenFeature([], tf.float32),
        's': tf.io.FixedLenFeature([], tf.string),
    }))
define the process funtion:
def preprocessing_fn(inputs):
    x = inputs['x']
    y = inputs['y']
    s = inputs['s']

    # data transformations using tft functions
    x_centered = x - tft.mean(x)
    y_normalized = tft.scale_to_0_1(y)
    s_integerized = tft.compute_and_apply_vocabulary(s)
    x_centered_times_y_normalized = (x_centered * y_normalized)

    # return the transformed data
    return {
        'x_centered': x_centered,
        'y_normalized': y_normalized,
        's_integerized': s_integerized,
        'x_centered_times_y_normalized': x_centered_times_y_normalized,
    }
apache beam flow:
# Ignore the warnings
tf.get_logger().setLevel('ERROR')

# a temporary directory is needed when analyzing the data
with tft_beam.Context(temp_dir=tempfile.mkdtemp()):
    # define the pipeline using Apache Beam syntax
    transformed_dataset, transform_fn = (
        # analyze and transform the dataset using the preprocessing function
        (raw_data, raw_data_metadata) | tft_beam.AnalyzeAndTransformDataset(preprocessing_fn))

# unpack the transformed dataset
transformed_data, transformed_metadata = transformed_dataset

# print the results
print('\nRaw data:\n{}\n'.format(pprint.pformat(raw_data)))
print('Transformed data:\n{}'.format(pprint.pformat(transformed_data)))
Feature selection
we try to understand which features are useful and which one are not, basically we are removing the features that do not influence the outcome (reducing the size of the feature space).
in unsupervised feature selection:
- features.target variable relationship not considered
- remove the redundant features (correlation with ohers)
we have different techniques:
- Filter methods We recall that correlated features are usually redundat (typically remove one), other filter are pearson correlation; we also have different correlation coeffieicent like kendall tau rank correlation coefficient, spearman’s rank correlation coefficient.
the skLearn univariate feature selection routines:
- SelectKbest
- SelectPercentile
- Wrapper methods
-
Forward selection: is and iterative, greedy method; it start with 1 feature and we evaluate model performance when adding each of the additional features, one at the time. we add next feature that gives the best performance and we go on.
-
Backward elimination: start with all features and we evaluate the model removing each of the included features, one at the time.
- Embedded methods Its a supervised method like l1 or l2 regularization and feature importance. They are intrinsically related to the model used (ridge lasso regression).
see notebooks.
Data Journey and data storage
Artifacts and the ML pipelines
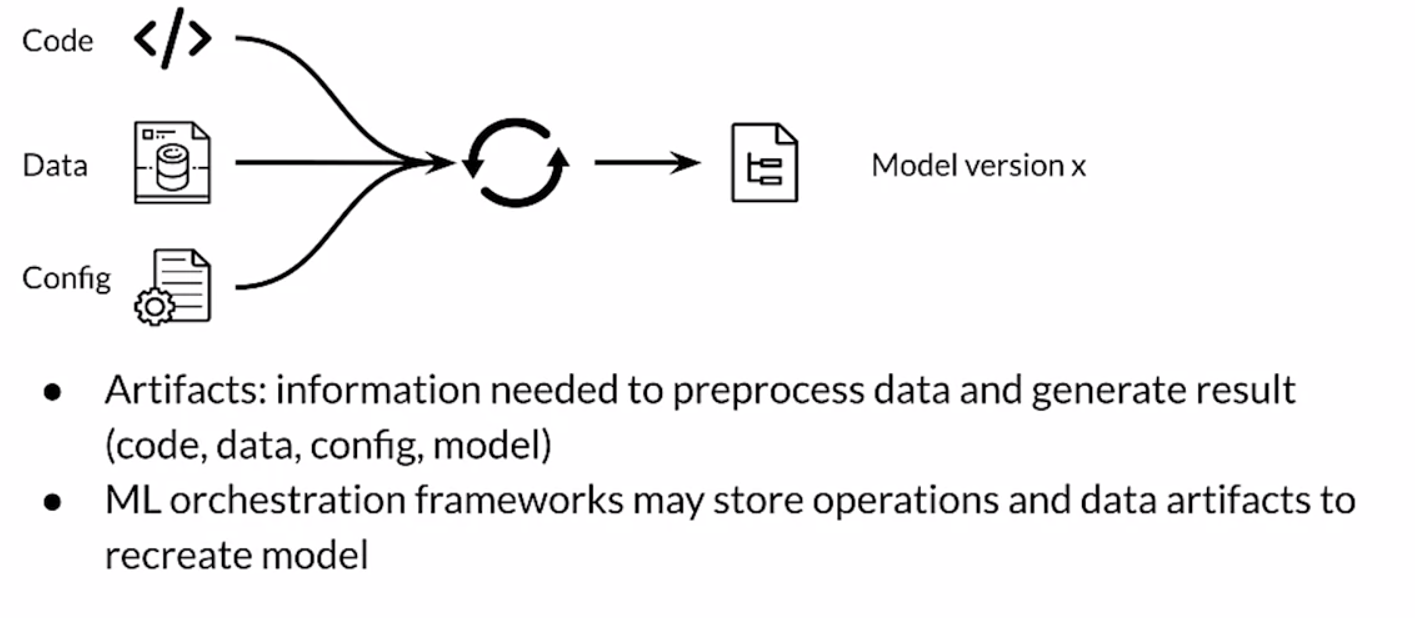
They are created as the components of the ML pipeline execute, it include all of the data and objects which are produced by the pipeline components (schema model itself, metrics etc.). the data provenance is the chain of transofrmations that led to the creation of a particular artiicat, they are very helpful for debugging and monitoring the model.
we can tracking different Data versioning, ML requires reproducibility also in term of code (git) and environment versioning (docker).
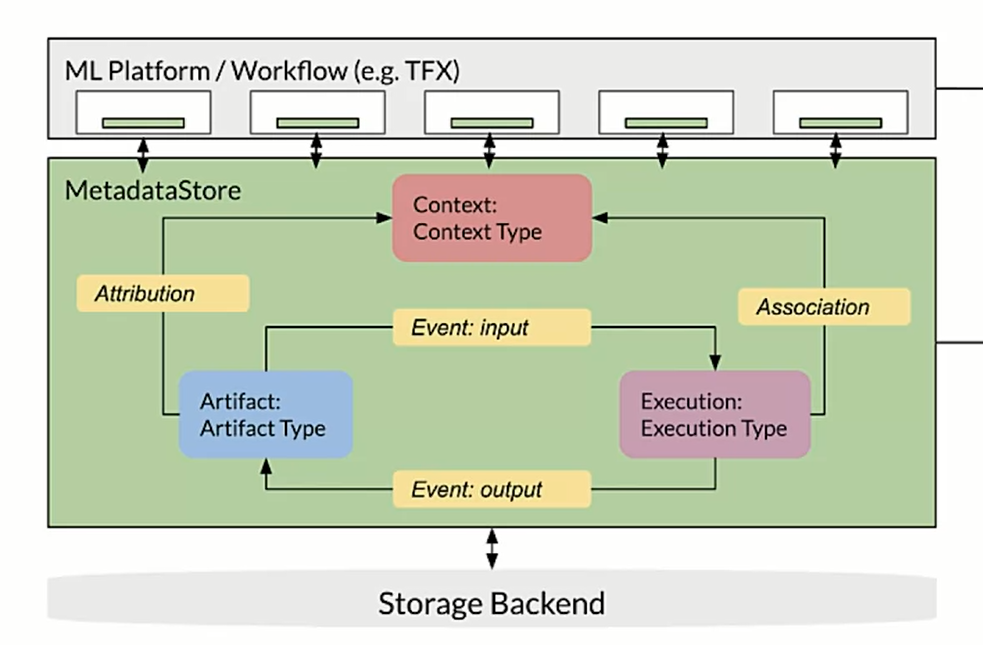
Meta-data
Being able to interpret a model and trace back the provenance of the data is very important for ML system. ML meta-data helps to keep track of this. Every run of the pipeline produce meta-data (equivalent to logging).
considering the ML data pipeline we have data validation and then data transformation; if we have centralized repository we store the result and the output of them. we can have a metadata store.
we can use the ML Metadata library, it supports multiple storage backends:
- Data entities to consider as units: artifact, execution and context.
- Types such as ArtifactType, ExecutionType, ContextType
-
relationships: event, attribution, assoociations.
ArtifactTypedescribes an artifact’s type and its properties that are stored in the metadata store. You can register these types on-the-fly with the metadata store in code, or you can load them in the store from a serialized format. Once you register a type, its definition is available throughout the lifetime of the store.- An
Artifactdescribes a specific instance of an ArtifactType, and its properties that are written to the metadata store. - An
ExecutionTypedescribes a type of component or step in a workflow, and its runtime parameters. - An
Executionis a record of a component run or a step in an ML workflow and the runtime parameters. An execution can be thought of as an instance of an ExecutionType. Executions are recorded when you run an ML pipeline or step. - An
Eventis a record of the relationship between artifacts and executions. When an execution happens, events record every artifact that was used by the execution, and every artifact that was produced. These records allow for lineage tracking throughout a workflow. By looking at all events, MLMD knows what executions happened and what artifacts were created as a result. MLMD can then recurse back from any artifact to all of its upstream inputs. - A
ContextTypedescribes a type of conceptual group of artifacts and executions in a workflow, and its structural properties. For example: projects, pipeline runs, experiments, owners etc. - A
Contextis an instance of a ContextType. It captures the shared information within the group. For example: project name, changelist commit id, experiment annotations etc. It has a user-defined unique name within its ContextType. - An
Attributionis a record of the relationship between artifacts and contexts. - An
Associationis a record of the relationship between executions and contexts.
all the components of the pipeline are connected to the MetadataStore; we can create is using Sqlite or MySql.
## sqlite
connection_config = metadata_store_pb2.ConnectionConfig()
connection_config.sqlite.filename_uri = "path"
connection_config.sqlite.connection_mode = 3

store = metadata_store.MetaDataStore(connection_config)

## mysql
connection_config = metadata_store_pb2.ConnectionConfig()
connection_config.mysql.host = "..."
connection_config.mysql.port = "..."
connection_config.mysql.database = "..."
connection_config.mysql.user = "..."
connection_config.mysql.password = "..."

store = metadata_store.MetaDataStore(connection_config)
Advance labelling
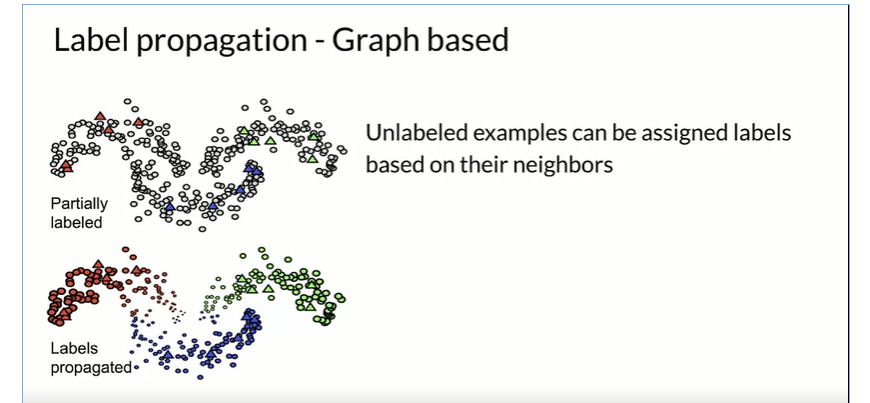
Semi-supervise learning
The starting situation is when you have a small pool human labeled data. the propagations of the labels to the unlabelled data id done computing some “similarity” ora “community structure”.
there are many way to perform this operation such as label propagation graph based
Active learning
we select the points to be labeled that would be most informative for model training. we select labels that will best help the model to train. we start we unlabeled pool data and we active learning sample trough a human annotator and label the most useful training data.
how do we do intelligent sampling? with active learning we choose the new observation that are most uncertain.
ML Deployment
Ml serving means make your model available to end user, when doing this operation we have to care about 3 key concepts: the model, an interpreter and the input data;
the importance metrics to be considered when deploying a model are: latency (delay between user action and response), cost, throughput (number of successful requests served per uni time eg call x secs).
as model become more complex the resource required increase (GPU, TPU, model registry and so on); finding the right balance between cost and complexity is the way. we have two way to evaluate a model: the first is the model’s metric such as the accuracy, precision, MSE and we also have to consider the satisfying gating metric such as the latency, the model size and the GPU load.
One factor is the use of accelerator, GPU tend to be optimized for parallel throughput while TPU are optimized for complex models and large batches.
To deal with latency a good solution is to use NoSQL database for caching data such as Redis, Google Cloud MemoryStore, google cloud Firestore, amazon dynamoDB.
The deployment when there are simple application could be a web app in which the users make requests via web application, the model is wrapped as API service (FastAPI, django, flask). Alternatives are Clipper which is an open.source from UC berkeley or TensorFlow Serving.
There are many advantages of serving with a managed service for instance realtime endpoint for low-latency predictions, scale automatically based on traffic, use GPU/TPU for faster predictions. Example of Google cloud AI platform
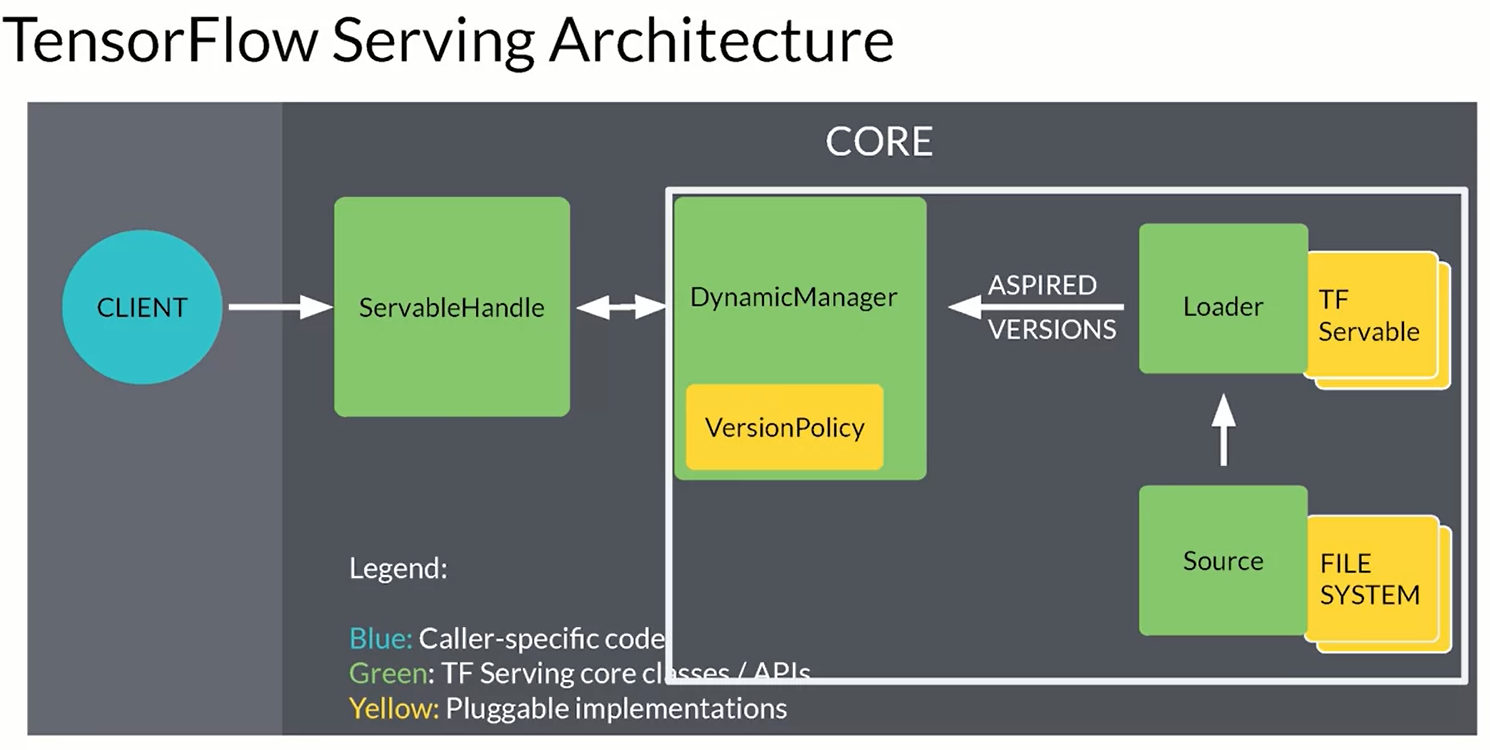
TensorFlow serving
the easiest way is using docker:
docker pull tensorflow/serving:latest-gpu
there is also an available Binaries called tensorflow-model-server.
Model serving architecture
We can perform two choice: On prem vs On Cloud. Typically large companies use on prem option while on cloud is prefered by small companies. In the first case you have to manually download and maintain when deploying on cloud you can use Virtual Machine and deploy on their infrastructure (and use provided ML workflow).
the high level architecture of a model is as follow: model file that is read by the model server that provide an API to use it (REST or gRPC). some of the most popular model servers are:
- TensorFLow serving
- TorchServe
- KubeFlow Serving
- Nvidia Triton Inference Server
looking at the more in details TensorFlow serving it provides and and real-time inference system, multi-model serving (A-B testing and so on)and exposes a gRPC and REST endpoints.
 {width=200}
Example with DOCKER and FASTAPI ( Guide)
Scaling infrastructure
There are two way to scale: vertical scaling (more RAM, GPU, increased power) or horizontal scaling (adding more device). cloud computing is useful since it allow to scale horizontally when needed and immediately scale down when finished. When choosing look if there is the possibility to manually scale, auto scaling, latency and cost of the platform.
when scaling horizontally there are a lot of problems related to the configuration/access/permission and son on. one solution to this problem is to use Virtual Machines. Containers are quite similar to VM but they do not require operating systems! one of the best solution is to use Docker management containers.
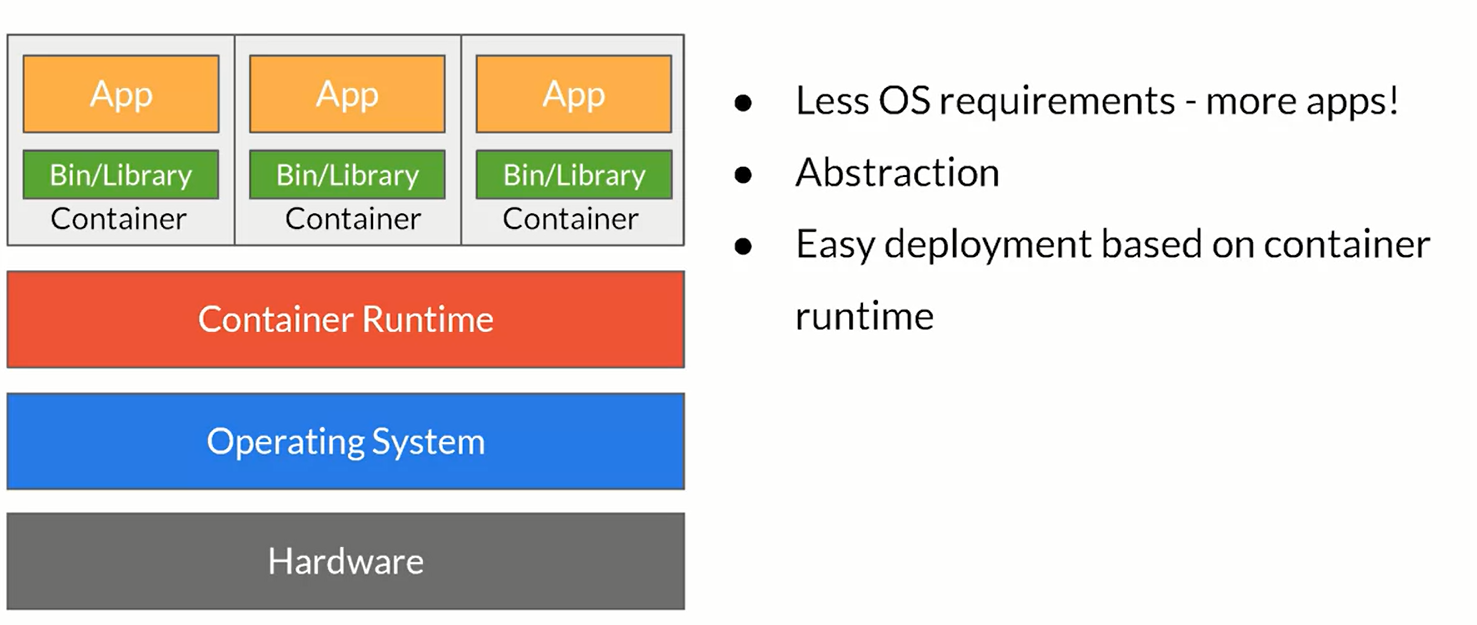
containers offer convenient way to scaling horizzontaly but there are some problems as well, like any app in a containers could go down. We want to be able to switch the traffic so the application never goes off.
The idea of orchestration is that having a set of tools that handle the life cycle of containers managers.
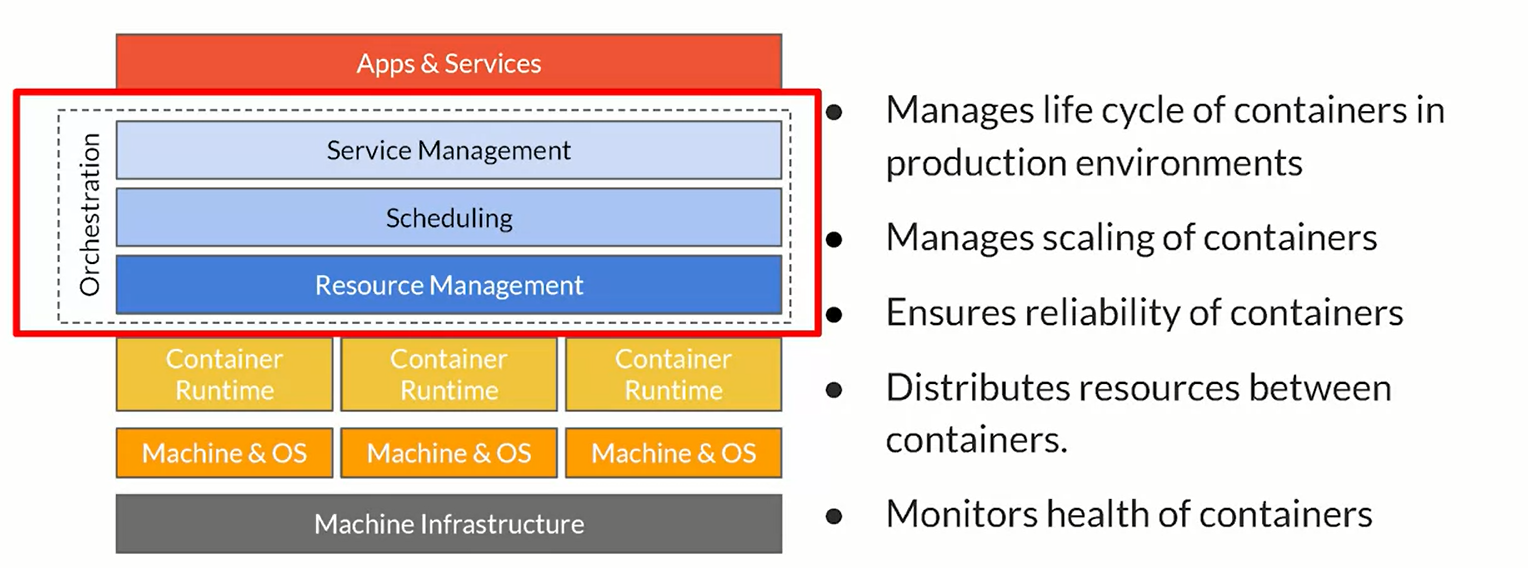
two of the mnost pupular container orchestration tools are Kubernetes and docker swarm. when using kubernetes Kubeflow is the choice.
(https://github.com/https-deeplearning-ai/machine-learning-engineering-for-production-public/tree/main/course4/week2-ungraded-labs/C4_W2_Lab_2_Intro_to_Kubernetes)
Data Processing and Inference
Online inference
If there are some popular products you can cache them and retrieve it faster than other requests. this type of cache is used with NoSQL database such as DynamoDB Redis and so on.
test the latency using locust, ( GUIDE )
Data preprocessing
the models deal with pre-process data and that must be done somewhere. when preprocessing we have to deal with:
- data cleansing (invalid data)
- feature tuning (normalization, clipping outliers, missing values)
- feature construction (combine inputs if needed)
- represent transformation (one-hot encoding, vectorization, …)
- feature selection
we have two tools that really help perform this operation at scale: apache Beam and tf transform.
Experiment Tracking
We need reproducible products and tools that allow to create ML system that are reliable and reproducible. What does it mean to track experiments?
- Enable you to duplicate a result (parameters, dataset, model version)
- Enable you to meaningfully compare experiments
- Manage code/data versions, hyperparameters, environment, metrics.
- Organize them in a meaningful way.
simple experiments are done with notebooks, however code is usually not promoted to production. There are some tools for managing notebook code such as nbconvert (.ipynb to .py), jupytext, neptune-notebooks.
As you perform experiments you have to tracking runtime parameters, the simples way is to use config files declaring the metric, learning rate and so on. as well with the parameters you also should perform data versioning; there are good tools for data versioning such as Neptune, git LFS, pachyderm and so on.
TensorBoard could be a tools for logging results or neptune.ai vs MLFLOW vs WANDB.
ML Solution lifecycle
CI / CD / CT / CM:
- Continuous integration
- Continuous delivery
- Continuous training
- Continuous monitoring
MLOPS level 0
the level of automation of ML Pipelines determines the maturity of the MLops process, the goal is to automate trining and deployment of ML models into the core softwares system, providing consistent monitoring. The level 0 is the manual process, including the EDA, the preparation, training and evaluation (Experimental Code).
in this manual process we have a less frequent releases, few CI/CD. there are many challenge in MLOps level 0:
- Need for actively monitoring the quality of your model in production
- Retraining your production models with new data
- Continuously experimenting with new implementations to improve the data and model.
MLOPS level 1-2
we have some sort of orchestrated experiment, there is a need to repeated experiment. The transition between steps are orchestrated; we need reusable, composable, and shareable components. When some triggers is pulled to pipeline is called and the new model is created and replace the previous.
ML Model versioning
Each model version can have different data, parameters and results, here ML models is used. In software deveoper we have 3 different type of version:
- Major: contains incompatible API changes
- Minor: adds functionality in a backward compatible manner
- Patch: makes backwards compatible bug fixes
in ML there is no defined ways, a possible approach consists of:
- Major: incompatibility in data or target variable
- Minor: model performance is improved
- Pipeline: pipeline of model training is changed
Model Lineage
is a set of relationship that lead to the model version researched.
model registry contains all the possible lineage:
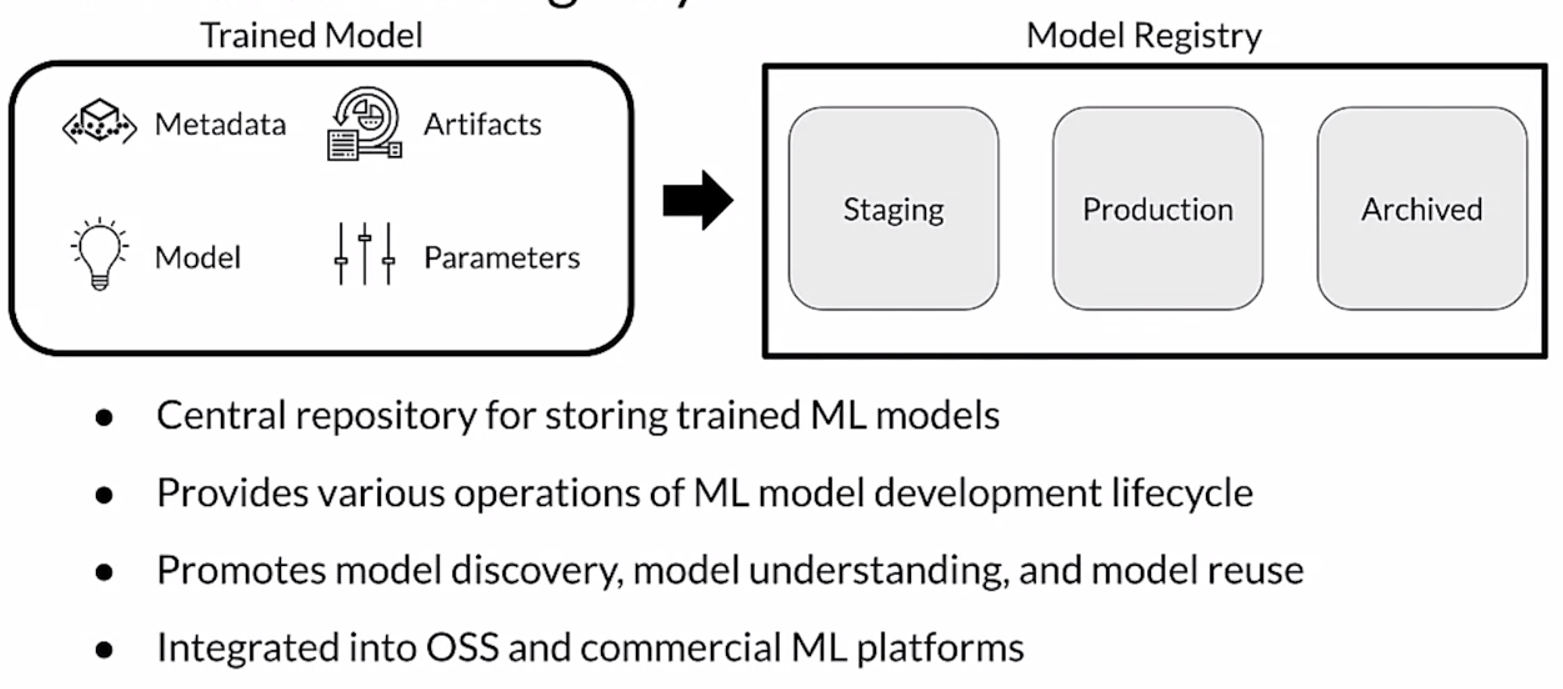
in the registry are recorded as well as meta data such as the model versions, the model serialized artifacts, free text annotations and links to other ML artifact and metadata stores.
Some good tools for ML registry are: Azure Ml model registry, SAS Model Manager, MLflow model registry, Google AI platform, Algorithmia.
Continous Delivery
it could be very useful tu use unittest and github! each time a new model is deployed all the test are runned and if there is some problems the operation is not completed. The main test are Unit testint, you can control that each component in the pipeline produces exteped artificat.
For input data is concerne that the feature engineering are correct, like test values, type values, test format ahd so forth. For the model it must be seen in a modular way as well, controlling for NaN, empty strings, shapes, accuracy and various metric.
You should cover edge and corners cases!
Monitoring Targets
- Model input distributions
- Model prediction distributions
- Model versions
- Input/prediction correlation
use the logs to keep track of the model inputs and predictions. Basic log storage is often unstructured way (like ElasticSearch);